はじめに
本記事では、k-means を用いてデータを分類(クラスタリング)します。
Python の機械学習ライブラリである scikit-learn を使用して実装します。
環境
以下が今回の環境です。
$ python -V
Python 3.7.10

$ pip list | grep -e numpy -e pandas -e matplotlib -e seaborn -e scikit-learn
matplotlib            3.5.2
matplotlib-inline     0.1.3
numpy                 1.21.6
pandas                1.3.5
scikit-learn          1.0.2
seaborn               0.11.2
処理の流れ
ライブラリをインポートします。
可視化には seaborn を使用します。
import pandas as pd
import matplotlib.pyplot as plt
import seaborn as sns
scikit-learn が提供するサンプルデータを使用するために load_iris をインポートします。
load_irisのデータは、3 種類の品種のアヤメのがく片(Sepal)、花弁(Petal)の幅および長さを計測したデータです。
from sklearn.datasets import load_iris

dataset = load_iris() # データセットの読み込み
x, t, columns = dataset.data, dataset.target, dataset.feature_names # データ、各データの分類、カラム名を取得
print(pd.DataFrame(x, columns=columns))
#      sepal length (cm)  sepal width (cm)  petal length (cm)  petal width (cm)
# 0                  5.1               3.5                1.4               0.2
# 1                  4.9               3.0                1.4               0.2
# 2                  4.7               3.2                1.3               0.2
# 3                  4.6               3.1                1.5               0.2
# 4                  5.0               3.6                1.4               0.2
# 5                  5.4               3.9                1.7               0.4
# 6                  4.6               3.4                1.4               0.3
# 7                  5.0               3.4                1.5               0.2
# 8                  4.4               2.9                1.4               0.2
# 9                  4.9               3.1                1.5               0.1
# 10                 5.4               3.7                1.5               0.2
#  ...
# 149                5.9               3.0                5.1               1.8

# [150 rows x 4 columns]

print(t)
# array([0, 0, 0, 0, 0, 0, 0, 0, 0, 0, 0, 0, 0, 0, 0, 0, 0, 0, 0, 0, 0, 0, 0,
#        0, 0, 0, 0, 0, 0, 0, 0, 0, 0, 0, 0, 0, 0, 0, 0, 0, 0, 0, 0, 0, 0, 0,
#        0, 0, 0, 0, 1, 1, 1, 1, 1, 1, 1, 1, 1, 1, 1, 1, 1, 1, 1, 1, 1, 1, 1,
#        1, 1, 1, 1, 1, 1, 1, 1, 1, 1, 1, 1, 1, 1, 1, 1, 1, 1, 1, 1, 1, 1, 1,
#        1, 1, 1, 1, 1, 1, 1, 1, 2, 2, 2, 2, 2, 2, 2, 2, 2, 2, 2, 2, 2, 2, 2,
#        2, 2, 2, 2, 2, 2, 2, 2, 2, 2, 2, 2, 2, 2, 2, 2, 2, 2, 2, 2, 2, 2, 2,
#        2, 2, 2, 2, 2, 2, 2, 2, 2, 2, 2, 2])
クラスタリングのアルゴリズムには k-means を使用します。
クラスタ数は人間が指定する必要があります。最適はクラスタ数は、シルエット分析などの分析結果や、分析対象に関する知識などから導く必要があります。
from sklearn.cluster import KMeans
kmeans = KMeans(n_clusters=3, random_state=0)
kmeans.fit(x) # 学習
cluster = kmeans.predict(x) # クラスタリング
print(cluster)
# [1 1 1 1 1 1 1 1 1 1 1 1 1 1 1 1 1 1 1 1 1 1 1 1 1 1 1 1 1 1 1 1 1 1 1 1 1
# 1 1 1 1 1 1 1 1 1 1 1 1 1 0 0 2 0 0 0 0 0 0 0 0 0 0 0 0 0 0 0 0 0 0 0 0 0
# 0 0 0 2 0 0 0 0 0 0 0 0 0 0 0 0 0 0 0 0 0 0 0 0 0 0 2 0 2 2 2 2 0 2 2 2 2
# 2 2 0 0 2 2 2 2 0 2 0 2 0 2 2 0 0 2 2 2 2 2 0 2 2 2 2 0 2 2 2 0 2 2 2 0 2
# 2 0]
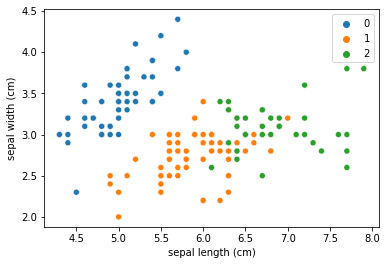
グラフを描画して、クラスタリングの結果を確認します。今回は例として”sepal length”と”sepal width”を使用して二次元で描画します。
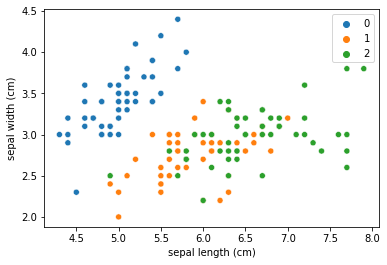
参考に、正解データも同様にグラフ化し、結果を比較してみると、似た結果になっていることも確認できます。
上がクラスタリング結果、下が実際の分類です。
sns.scatterplot(df_results['sepal length (cm)'], df_results['sepal width (cm)'],
                hue=cluster, palette=sns.color_palette(n_colors=3)
                )
plt.savefig("cluster.png") # グラフの保存
plt.clf() # グラフの初期化

sns.scatterplot(df_results['sepal length (cm)'], df_results['sepal width (cm)'],
                hue=t, palette=sns.color_palette(n_colors=3)
                )
plt.savefig("target.png")

サンプルコードまとめ
import pandas as pd
import matplotlib.pyplot as plt
import seaborn as sns

from sklearn.datasets import load_iris

dataset = load_iris() # データセットの読み込み

x, t, columns = dataset.data, dataset.target, dataset.feature_names # データとカラム名を取得
print(f'x.shape:{x.shape}')

from sklearn.cluster import KMeans
kmeans = KMeans(n_clusters=3, random_state=0)
kmeans.fit(x)
cluster = kmeans.predict(x)

df_results = pd.DataFrame(x, columns=columns)
df_results['target'] = t
df_results['predict']=cluster
print(df_results)

sns.scatterplot(df_results['sepal length (cm)'], df_results['sepal width (cm)'],
                hue=cluster, palette=sns.color_palette(n_colors=3)
                )
plt.savefig("cluster.png") # グラフの保存
plt.clf() # グラフの初期化

sns.scatterplot(df_results['sepal length (cm)'], df_results['sepal width (cm)'],
                hue=t, palette=sns.color_palette(n_colors=3)
                )
plt.savefig("target.png")
おわりに
本記事では、k-means を用いてデータを分類(クラスタリング)します。 この記事がどなたかの参考になれば幸いです。


コメント